Observability with OpenTelemetry
Observability is the key to turning experimental AI into reliable software. Gemini CLI provides built-in support for OpenTelemetry, transforming every agent interaction into a rich stream of logs, metrics, and traces. This three-pillar approach gives you the high-fidelity visibility needed to understand agent behavior, optimize performance, and ensure reliability across your entire workflow.
Whether you are debugging a complex tool interaction locally or monitoring enterprise-wide usage in the cloud, Gemini CLI’s observability system provides the actionable intelligence needed to move from “black box” AI to predictable, high-performance systems.
OpenTelemetry integration
Section titled “OpenTelemetry integration”Gemini CLI integrates with OpenTelemetry, a vendor-neutral, industry-standard observability framework.
The observability system provides:
- Universal compatibility: Export to any OpenTelemetry backend (Google Cloud, Jaeger, Prometheus, Datadog, etc.).
- Standardized data: Use consistent formats and collection methods across your toolchain.
- Future-proof integration: Connect with existing and future observability infrastructure.
- No vendor lock-in: Switch between backends without changing your instrumentation.
Configuration
Section titled “Configuration”You control telemetry behavior through the .gemini/settings.json file.
Environment variables can override these settings.
| Setting | Environment Variable | Description | Values | Default |
|---|---|---|---|---|
enabled | GEMINI_TELEMETRY_ENABLED | Enable or disable telemetry | true/false | false |
traces | GEMINI_TELEMETRY_TRACES_ENABLED | Enable detailed attribute tracing | true/false | false |
target | GEMINI_TELEMETRY_TARGET | Where to send telemetry data | "gcp"/"local" | "local" |
otlpEndpoint | GEMINI_TELEMETRY_OTLP_ENDPOINT | OTLP collector endpoint | URL string | http://localhost:4317 |
otlpProtocol | GEMINI_TELEMETRY_OTLP_PROTOCOL | OTLP transport protocol | "grpc"/"http" | "grpc" |
outfile | GEMINI_TELEMETRY_OUTFILE | Save telemetry to file (overrides otlpEndpoint) | file path | - |
logPrompts | GEMINI_TELEMETRY_LOG_PROMPTS | Include prompts in telemetry logs | true/false | true |
useCollector | GEMINI_TELEMETRY_USE_COLLECTOR | Use external OTLP collector (advanced) | true/false | false |
useCliAuth | GEMINI_TELEMETRY_USE_CLI_AUTH | Use CLI credentials for telemetry (GCP target only) | true/false | false |
| - | GEMINI_CLI_SURFACE | Optional custom label for traffic reporting | string | - |
Note on boolean environment variables: For boolean settings like enabled,
setting the environment variable to true or 1 enables the feature.
For detailed configuration information, see the Configuration guide.
Google Cloud telemetry
Section titled “Google Cloud telemetry”You can export telemetry data directly to Google Cloud Trace, Cloud Monitoring, and Cloud Logging.
Prerequisites
Section titled “Prerequisites”You must complete several setup steps before enabling Google Cloud telemetry.
-
Set your Google Cloud project ID:
-
To send telemetry to a separate project:
macOS/Linux
Terminal window export OTLP_GOOGLE_CLOUD_PROJECT="your-telemetry-project-id"Windows (PowerShell)
Terminal window $env:OTLP_GOOGLE_CLOUD_PROJECT="your-telemetry-project-id" -
To send telemetry to the same project as inference:
macOS/Linux
Terminal window export GOOGLE_CLOUD_PROJECT="your-project-id"Windows (PowerShell)
Terminal window $env:GOOGLE_CLOUD_PROJECT="your-project-id"
-
-
Authenticate with Google Cloud using one of these methods:
-
Method A: Application Default Credentials (ADC): Use this method for service accounts or standard
gcloudauthentication.-
For user accounts:
Terminal window gcloud auth application-default login -
For service accounts:
macOS/Linux
Terminal window export GOOGLE_APPLICATION_CREDENTIALS="/path/to/your/service-account.json"Windows (PowerShell)
Terminal window $env:GOOGLE_APPLICATION_CREDENTIALS="C:\path\to\your\service-account.json"
-
-
Method B: CLI Auth (Direct export only): Simplest method for local users. Gemini CLI uses the same OAuth credentials you used for login. To enable this, set
useCliAuth: truein your.gemini/settings.json:{"telemetry": {"enabled": true,"target": "gcp","useCliAuth": true}}
-
-
Ensure your account or service account has these IAM roles:
- Cloud Trace Agent
- Monitoring Metric Writer
- Logs Writer
-
Enable the required Google Cloud APIs:
Terminal window gcloud services enable \cloudtrace.googleapis.com \monitoring.googleapis.com \logging.googleapis.com \--project="$OTLP_GOOGLE_CLOUD_PROJECT"
Direct export
Section titled “Direct export”We recommend using direct export to send telemetry directly to Google Cloud services.
- Enable telemetry in
.gemini/settings.json:{"telemetry": {"enabled": true,"target": "gcp"}} - Run Gemini CLI and send prompts.
- View logs, metrics, and traces in the Google Cloud Console. See View Google Cloud telemetry for details.
View Google Cloud telemetry
Section titled “View Google Cloud telemetry”After you enable telemetry and run Gemini CLI, you can view your data in the Google Cloud Console.
- Logs: Logs Explorer
- Metrics: Metrics Explorer
- Traces: Trace Explorer
For detailed information on how to use these tools, see the following official Google Cloud documentation:
- View and analyze logs with Logs Explorer
- Create charts with Metrics Explorer
- Find and explore traces
Monitoring dashboards
Section titled “Monitoring dashboards”Gemini CLI provides a pre-configured Google Cloud Monitoring dashboard to visualize your telemetry.
Find this dashboard under Google Cloud Monitoring Dashboard Templates as “Gemini CLI Monitoring”.
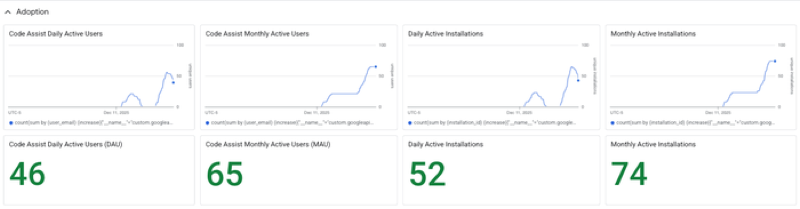
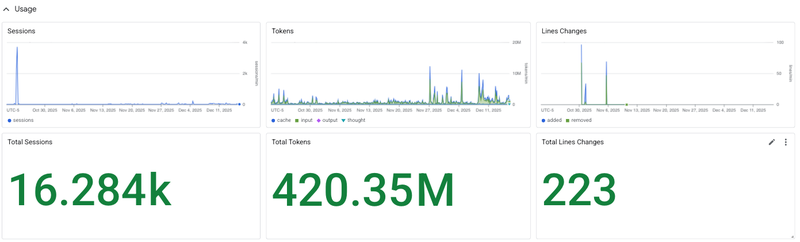
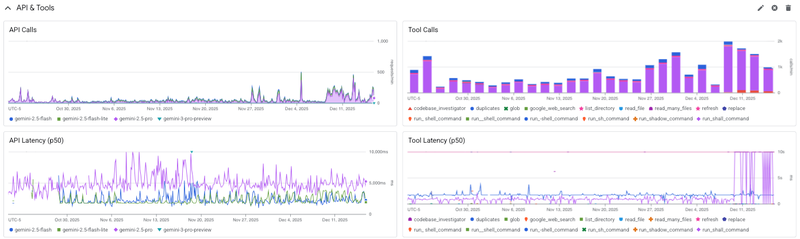
To learn more, see Instant insights: Gemini CLI’s pre-configured monitoring dashboards.
Local telemetry
Section titled “Local telemetry”You can capture telemetry data locally for development and debugging. We recommend using file-based output for local development.
- Enable telemetry in
.gemini/settings.json:{"telemetry": {"enabled": true,"target": "local","outfile": ".gemini/telemetry.log"}} - Run Gemini CLI and send prompts.
- View logs and metrics in
.gemini/telemetry.log.
For advanced local telemetry setups (such as Jaeger or Genkit), see the Local development guide.
Client identification
Section titled “Client identification”Gemini CLI includes identifiers in its User-Agent header to help you
differentiate and report on API traffic from different environments (for
example, identifying calls from Gemini Code Assist versus a standard terminal).
Automatic identification
Section titled “Automatic identification”Most integrated environments are identified automatically without additional
configuration. The identifier is included as a prefix to the User-Agent and as
a “surface” tag in the parenthetical metadata.
| Environment | User-Agent Prefix | Surface Tag |
|---|---|---|
| Gemini Code Assist (Agent Mode) | GeminiCLI-a2a-server | vscode |
| Zed (via ACP) | GeminiCLI-acp-zed | zed |
| XCode (via ACP) | GeminiCLI-acp-xcode | xcode |
| IntelliJ IDEA (via ACP) | GeminiCLI-acp-intellijidea | jetbrains |
| Standard Terminal | GeminiCLI | terminal |
Example User-Agent:
GeminiCLI-a2a-server/0.34.0/gemini-pro (linux; x64; vscode)
Custom identification
Section titled “Custom identification”You can provide a custom identifier for your own scripts or automation by
setting the GEMINI_CLI_SURFACE environment variable. This is useful for
tracking specific internal tools or distribution channels in your GCP logs.
macOS/Linux
export GEMINI_CLI_SURFACE="my-custom-tool"Windows (PowerShell)
$env:GEMINI_CLI_SURFACE="my-custom-tool"When set, the value appears at the end of the User-Agent parenthetical:
GeminiCLI/0.34.0/gemini-pro (linux; x64; my-custom-tool)
Logs, metrics, and traces
Section titled “Logs, metrics, and traces”This section describes the structure of logs, metrics, and traces generated by Gemini CLI.
Gemini CLI includes session.id, installation.id, active_approval_mode, and
user.email (when authenticated) as common attributes on all data.
Logs provide timestamped records of specific events. Gemini CLI logs events across several categories.
Sessions
Section titled “Sessions”Session logs capture startup configuration and prompt submissions.
gemini_cli.config
Section titled “gemini_cli.config”Emitted at startup with the CLI configuration.
Attributes
model(string)embedding_model(string)sandbox_enabled(boolean)core_tools_enabled(string)approval_mode(string)api_key_enabled(boolean)vertex_ai_enabled(boolean)log_user_prompts_enabled(boolean)file_filtering_respect_git_ignore(boolean)debug_mode(boolean)mcp_servers(string)mcp_servers_count(int)mcp_tools(string)mcp_tools_count(int)output_format(string)extensions(string)extension_ids(string)extensions_count(int)auth_type(string)worktree_active(boolean)github_workflow_name(string, optional)github_repository_hash(string, optional)github_event_name(string, optional)github_pr_number(string, optional)github_issue_number(string, optional)github_custom_tracking_id(string, optional)
gemini_cli.user_prompt
Section titled “gemini_cli.user_prompt”Emitted when you submit a prompt.
Attributes
prompt_length(int)prompt_id(string)prompt(string; excluded iftelemetry.logPromptsisfalse)auth_type(string)
Approval mode
Section titled “Approval mode”These logs track changes to and usage of different approval modes.
Lifecycle
Section titled “Lifecycle”approval_mode_switch
Section titled “approval_mode_switch”Logs when you change the approval mode.
Attributes
from_mode(string)to_mode(string)
approval_mode_duration
Section titled “approval_mode_duration”Records time spent in an approval mode.
Attributes
mode(string)duration_ms(int)
Execution
Section titled “Execution”plan_execution
Section titled “plan_execution”Logs when you execute a plan and switch from plan mode to active execution.
Attributes
approval_mode(string)
Tool logs capture executions, truncation, and edit behavior.
gemini_cli.tool_call
Section titled “gemini_cli.tool_call”Emitted for each tool (function) call.
Attributes
function_name(string)function_args(string)duration_ms(int)success(boolean)decision(string: “accept”, “reject”, “auto_accept”, or “modify”)error(string, optional)error_type(string, optional)prompt_id(string)tool_type(string: “native” or “mcp”)mcp_server_name(string, optional)extension_name(string, optional)extension_id(string, optional)content_length(int, optional)start_time(number, optional)end_time(number, optional)metadata(object, optional), which may include:model_added_lines(number)model_removed_lines(number)user_added_lines(number)user_removed_lines(number)ask_user(object)
gemini_cli.tool_output_truncated
Section titled “gemini_cli.tool_output_truncated”Logs when tool output is truncated.
Attributes
tool_name(string)original_content_length(int)truncated_content_length(int)threshold(int)lines(int)prompt_id(string)
gemini_cli.edit_strategy
Section titled “gemini_cli.edit_strategy”Records the chosen edit strategy.
Attributes
strategy(string)
gemini_cli.edit_correction
Section titled “gemini_cli.edit_correction”Records the result of an edit correction.
Attributes
correction(string: “success” or “failure”)
gen_ai.client.inference.operation.details
Section titled “gen_ai.client.inference.operation.details”Provides detailed GenAI operation data aligned with OpenTelemetry conventions.
Attributes
gen_ai.request.model(string)gen_ai.provider.name(string)gen_ai.operation.name(string)gen_ai.input.messages(json string)gen_ai.output.messages(json string)gen_ai.response.finish_reasons(array of strings)gen_ai.usage.input_tokens(int)gen_ai.usage.output_tokens(int)gen_ai.request.temperature(float)gen_ai.request.top_p(float)gen_ai.request.top_k(int)gen_ai.request.max_tokens(int)gen_ai.system_instructions(json string)server.address(string)server.port(int)
File logs track operations performed by tools.
gemini_cli.file_operation
Section titled “gemini_cli.file_operation”Emitted for each file creation, read, or update.
Attributes
tool_name(string)operation(string: “create”, “read”, or “update”)lines(int, optional)mimetype(string, optional)extension(string, optional)programming_language(string, optional)
API logs capture requests, responses, and errors from Gemini API.
gemini_cli.api_request
Section titled “gemini_cli.api_request”Request sent to Gemini API.
Attributes
model(string)prompt_id(string)role(string: “user”, “model”, or “system”)request_text(string, optional)
gemini_cli.api_response
Section titled “gemini_cli.api_response”Response received from Gemini API.
Attributes
model(string)status_code(int or string)duration_ms(int)input_token_count(int)output_token_count(int)cached_content_token_count(int)thoughts_token_count(int)tool_token_count(int)total_token_count(int)prompt_id(string)auth_type(string)finish_reasons(array of strings)response_text(string, optional)
gemini_cli.api_error
Section titled “gemini_cli.api_error”Logs when an API request fails.
Attributes
error.message(string)model_name(string)duration(int)prompt_id(string)auth_type(string)error_type(string, optional)status_code(int or string, optional)role(string, optional)
gemini_cli.malformed_json_response
Section titled “gemini_cli.malformed_json_response”Logs when a JSON response cannot be parsed.
Attributes
model(string)
Model routing
Section titled “Model routing”These logs track how Gemini CLI selects and routes requests to models.
gemini_cli.slash_command
Section titled “gemini_cli.slash_command”Logs slash command execution.
Attributes
command(string)subcommand(string, optional)status(string: “success” or “error”)
gemini_cli.slash_command.model
Section titled “gemini_cli.slash_command.model”Logs model selection via slash command.
Attributes
model_name(string)
gemini_cli.model_routing
Section titled “gemini_cli.model_routing”Records model router decisions and reasoning.
Attributes
decision_model(string)decision_source(string)routing_latency_ms(int)reasoning(string, optional)failed(boolean)error_message(string, optional)approval_mode(string)
Chat and streaming
Section titled “Chat and streaming”These logs track chat context compression and streaming chunk errors.
gemini_cli.chat_compression
Section titled “gemini_cli.chat_compression”Logs chat context compression events.
Attributes
tokens_before(int)tokens_after(int)
gemini_cli.chat.invalid_chunk
Section titled “gemini_cli.chat.invalid_chunk”Logs invalid chunks received in a stream.
Attributes
error_message(string, optional)
gemini_cli.chat.content_retry
Section titled “gemini_cli.chat.content_retry”Logs retries due to content errors.
Attributes
attempt_number(int)error_type(string)retry_delay_ms(int)model(string)
gemini_cli.chat.content_retry_failure
Section titled “gemini_cli.chat.content_retry_failure”Logs when all content retries fail.
Attributes
total_attempts(int)final_error_type(string)total_duration_ms(int, optional)model(string)
gemini_cli.conversation_finished
Section titled “gemini_cli.conversation_finished”Logs when a conversation session ends.
Attributes
approvalMode(string)turnCount(int)
Resilience
Section titled “Resilience”Resilience logs record fallback mechanisms and recovery attempts.
gemini_cli.flash_fallback
Section titled “gemini_cli.flash_fallback”Logs switch to a flash model fallback.
Attributes
auth_type(string)
gemini_cli.ripgrep_fallback
Section titled “gemini_cli.ripgrep_fallback”Logs fallback to standard grep.
Attributes
error(string, optional)
gemini_cli.web_fetch_fallback_attempt
Section titled “gemini_cli.web_fetch_fallback_attempt”Logs web-fetch fallback attempts.
Attributes
reason(string: “private_ip” or “primary_failed”)
gemini_cli.agent.recovery_attempt
Section titled “gemini_cli.agent.recovery_attempt”Logs attempts to recover from agent errors.
Attributes
agent_name(string)attempt_number(int)success(boolean)error_type(string, optional)
Extensions
Section titled “Extensions”Extension logs track lifecycle events and settings changes.
gemini_cli.extension_install
Section titled “gemini_cli.extension_install”Logs when you install an extension.
Attributes
extension_name(string)extension_version(string)extension_source(string)status(string)
gemini_cli.extension_uninstall
Section titled “gemini_cli.extension_uninstall”Logs when you uninstall an extension.
Attributes
extension_name(string)status(string)
gemini_cli.extension_enable
Section titled “gemini_cli.extension_enable”Logs when you enable an extension.
Attributes
extension_name(string)setting_scope(string)
gemini_cli.extension_disable
Section titled “gemini_cli.extension_disable”Logs when you disable an extension.
Attributes
extension_name(string)setting_scope(string)
Agent runs
Section titled “Agent runs”Agent logs track the lifecycle of agent executions.
gemini_cli.agent.start
Section titled “gemini_cli.agent.start”Logs when an agent run begins.
Attributes
agent_id(string)agent_name(string)
gemini_cli.agent.finish
Section titled “gemini_cli.agent.finish”Logs when an agent run completes.
Attributes
agent_id(string)agent_name(string)duration_ms(int)turn_count(int)terminate_reason(string)
IDE logs capture connectivity events for the IDE companion.
gemini_cli.ide_connection
Section titled “gemini_cli.ide_connection”Logs IDE companion connections.
Attributes
connection_type(string)
UI logs track terminal rendering issues.
kitty_sequence_overflow
Section titled “kitty_sequence_overflow”Logs terminal control sequence overflows.
Attributes
sequence_length(int)truncated_sequence(string)
Miscellaneous
Section titled “Miscellaneous”gemini_cli.rewind
Section titled “gemini_cli.rewind”Logs when the conversation state is rewound.
Attributes
outcome(string)
gemini_cli.conseca.verdict
Section titled “gemini_cli.conseca.verdict”Logs security verdicts from ConSeca.
Attributes
verdict(string)decision(string: “accept”, “reject”, or “modify”)reason(string, optional)tool_name(string, optional)
gemini_cli.hook_call
Section titled “gemini_cli.hook_call”Logs execution of lifecycle hooks.
Attributes
hook_name(string)hook_type(string)duration_ms(int)success(boolean)
gemini_cli.tool_output_masking
Section titled “gemini_cli.tool_output_masking”Logs when tool output is masked for privacy.
Attributes
tokens_before(int)tokens_after(int)masked_count(int)total_prunable_tokens(int)
gemini_cli.keychain.availability
Section titled “gemini_cli.keychain.availability”Logs keychain availability checks.
Attributes
available(boolean)
gemini_cli.startup_stats
Section titled “gemini_cli.startup_stats”Logs detailed startup performance statistics.
Attributes
phases(json array of startup phases)os_platform(string)os_release(string)is_docker(boolean)
Metrics
Section titled “Metrics”Metrics provide numerical measurements of behavior over time.
Custom metrics
Section titled “Custom metrics”Gemini CLI exports several custom metrics.
Sessions
Section titled “Sessions”gemini_cli.session.count
Section titled “gemini_cli.session.count”Incremented once per CLI startup.
Onboarding
Section titled “Onboarding”Tracks onboarding flow from authentication to the user
-
gemini_cli.onboarding.start(Counter, Int): Incremented when the authentication flow begins. -
gemini_cli.onboarding.success(Counter, Int): Incremented when the user onboarding flow completes successfully.
Attributes (Success)
user_tier(string)
gemini_cli.tool.call.count
Section titled “gemini_cli.tool.call.count”Counts tool calls.
Attributes
function_name(string)success(boolean)decision(string: “accept”, “reject”, “modify”, or “auto_accept”)tool_type(string: “mcp” or “native”)
gemini_cli.tool.call.latency
Section titled “gemini_cli.tool.call.latency”Measures tool call latency (in ms).
Attributes
function_name(string)
gemini_cli.api.request.count
Section titled “gemini_cli.api.request.count”Counts all API requests.
Attributes
model(string)status_code(int or string)error_type(string, optional)
gemini_cli.api.request.latency
Section titled “gemini_cli.api.request.latency”Measures API request latency (in ms).
Attributes
model(string)
Token usage
Section titled “Token usage”gemini_cli.token.usage
Section titled “gemini_cli.token.usage”Counts input, output, thought, cache, and tool tokens.
Attributes
model(string)type(string: “input”, “output”, “thought”, “cache”, or “tool”)
gemini_cli.file.operation.count
Section titled “gemini_cli.file.operation.count”Counts file operations.
Attributes
operation(string: “create”, “read”, or “update”)lines(int, optional)mimetype(string, optional)extension(string, optional)programming_language(string, optional)
gemini_cli.lines.changed
Section titled “gemini_cli.lines.changed”Counts added or removed lines.
Attributes
function_name(string, optional)type(string: “added” or “removed”)
Chat and streaming
Section titled “Chat and streaming”gemini_cli.chat_compression
Section titled “gemini_cli.chat_compression”Counts compression operations.
Attributes
tokens_before(int)tokens_after(int)
gemini_cli.chat.invalid_chunk.count
Section titled “gemini_cli.chat.invalid_chunk.count”Counts invalid stream chunks.
gemini_cli.chat.content_retry.count
Section titled “gemini_cli.chat.content_retry.count”Counts content error retries.
gemini_cli.chat.content_retry_failure.count
Section titled “gemini_cli.chat.content_retry_failure.count”Counts requests where all retries failed.
Model routing
Section titled “Model routing”gemini_cli.slash_command.model.call_count
Section titled “gemini_cli.slash_command.model.call_count”Counts model selections.
Attributes
slash_command.model.model_name(string)
gemini_cli.model_routing.latency
Section titled “gemini_cli.model_routing.latency”Measures routing decision latency.
Attributes
routing.decision_model(string)routing.decision_source(string)routing.approval_mode(string)
gemini_cli.model_routing.failure.count
Section titled “gemini_cli.model_routing.failure.count”Counts routing failures.
Attributes
routing.decision_source(string)routing.error_message(string)routing.approval_mode(string)
Agent runs
Section titled “Agent runs”gemini_cli.agent.run.count
Section titled “gemini_cli.agent.run.count”Counts agent runs.
Attributes
agent_name(string)terminate_reason(string)
gemini_cli.agent.duration
Section titled “gemini_cli.agent.duration”Measures agent run duration.
Attributes
agent_name(string)
gemini_cli.agent.turns
Section titled “gemini_cli.agent.turns”Counts turns per agent run.
Attributes
agent_name(string)
Approval mode
Section titled “Approval mode”gemini_cli.plan.execution.count
Section titled “gemini_cli.plan.execution.count”Counts plan executions.
Attributes
approval_mode(string)
gemini_cli.ui.flicker.count
Section titled “gemini_cli.ui.flicker.count”Counts terminal flicker events.
Performance
Section titled “Performance”Gemini CLI provides detailed performance metrics for advanced monitoring.
gemini_cli.startup.duration
Section titled “gemini_cli.startup.duration”Measures startup time by phase.
Attributes
phase(string)details(map, optional)
gemini_cli.memory.usage
Section titled “gemini_cli.memory.usage”Measures heap and RSS memory.
Attributes
memory_type(string: “heap_used”, “heap_total”, “external”, “rss”)component(string, optional)
gemini_cli.cpu.usage
Section titled “gemini_cli.cpu.usage”Measures CPU usage percentage.
Attributes
component(string, optional)
gemini_cli.tool.queue.depth
Section titled “gemini_cli.tool.queue.depth”Measures tool execution queue depth.
gemini_cli.tool.execution.breakdown
Section titled “gemini_cli.tool.execution.breakdown”Breaks down tool time by phase.
Attributes
function_name(string)phase(string: “validation”, “preparation”, “execution”, “result_processing”)
GenAI semantic convention
Section titled “GenAI semantic convention”These metrics follow standard OpenTelemetry GenAI semantic conventions.
gen_ai.client.token.usage: Counts tokens used per operation.gen_ai.client.operation.duration: Measures operation duration in seconds.
Traces
Section titled “Traces”Traces provide an “under-the-hood” view of agent and backend operations. Use traces to debug tool interactions and optimize performance.
Every trace captures rich metadata via standard span attributes.
Standard span attributes
gen_ai.operation.name: High-level operation (for example,tool_call,llm_call,user_prompt,system_prompt,agent_call, orschedule_tool_calls).gen_ai.agent.name: Set togemini-cli.gen_ai.agent.description: The service agent description.gen_ai.input.messages: Input data or metadata.gen_ai.output.messages: Output data or results.gen_ai.request.model: Request model name.gen_ai.response.model: Response model name.gen_ai.prompt.name: The prompt name.gen_ai.tool.name: Executed tool name.gen_ai.tool.call_id: Unique ID for the tool call.gen_ai.tool.description: Tool description.gen_ai.tool.definitions: Tool definitions in JSON format.gen_ai.usage.input_tokens: Number of input tokens.gen_ai.usage.output_tokens: Number of output tokens.gen_ai.system_instructions: System instructions in JSON format.gen_ai.conversation.id: The CLI session ID.
For more details on semantic conventions for events, see the OpenTelemetry documentation.